At DataSF we aim to help departments use data to drive decision making. In fact it’s an explicit part of our mandate! Chapter 22D of the City’s Admin Code tasks DataSF with “assist[ing] City departments with analysis of City data sets to improve decision making.” But between you and me, we love data so much, we would do this even if we didn’t have to!
To achieve this, DataSF works with the City’s analysts. The City and County of San Francisco is fortunate to employ some of the smartest and entrepreneurial data lovers you can find anywhere. They want nothing more than to dive into the data and discover new insights to improve city services. Unfortunately, we found there were several barriers stopping them from unlocking their potential.
- Painful Manual Reporting - These talented individuals spent much of their time on endless manual updates of mandatory reports
- Tools not Fit for Purpose - Analysis is in high demand, but moving with any speed is difficult if the tools aren’t designed for agile and iterative work
- Lack of Support Network - For a given tool (and there were many analysts were using) there was no central support network to foster knowledge sharing and collaboration.
In 2017 DataSF embarked on a landscape review of dashboarding tools, deciding on Power BI for its ease of use, robust and integrated ETL (data wrangling), and orientation to self-service while still scaling to enterprise grade service. To support it, we developed a robust suite of trainings for analysts, a department Power BI accelerator, analyst centered documentation, regular office hours, and started an online community of practice to knit everyone together.
The results have been astounding, and we want to share out a small sample of the great work analysts have done. We are proud to launch a new Power BI showcase page alongside our DataScienceSF showcase. Inside you can read 3 brief case studies of how departments are leveraging Power BI to save time, increase revenue, and promote transparency.
Learn how the:
- Controller’s Office City Performance Unit reduced staff hours spent maintaining dashboards by 80% by switching from Tableau to Power BI
- Office of Assessor-Recorder streamlined a process involving manual maintenance of 60 excel workbooks into an automated Power BI pipeline
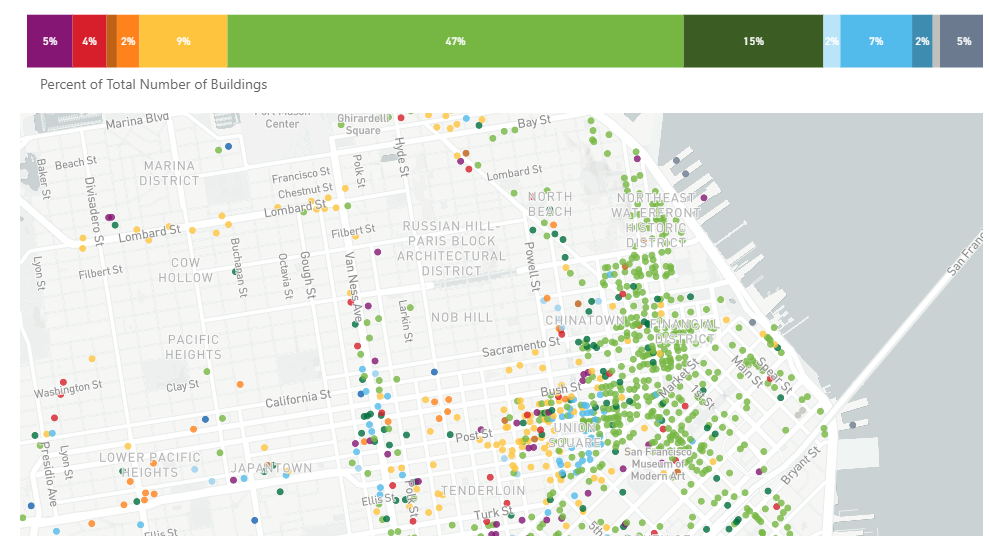
- SF Environment brought an important benchmarking dataset to life for residents, businesses, and stakeholders
In the coming months we will be blogging more about different aspects of the DataSF Dashboarding service. And we will be updating the showcase with even more exciting use cases.
