Background
Reducing greenhouse gas emissions is in everyone’s best interest. SF Environment is ensuring everyone in San Francisco plays their part via programs, outreach, and community engagement. The good news: greenhouse gas emissions (GHG) from San Francisco have been reduced 36% since 1990. The not-so-good news: Buildings and Transportation remain the largest sources; 44% of citywide GHG’s come from buildings. In 2011, the Existing Buildings Energy Performance Ordinance was passed to help improve energy efficiency and reduce greenhouse gas emissions from buildings. As specified in the ordinance, each year building owners are required to report energy usage data to the Department for benchmarking purposes. SF Environment uses this data to engage and collaborate with building owners to reduce energy use.
What was the problem
The purpose of the Existing Buildings Ordinance is to use transparency to motivate improvement. The ordinance requires the building owner to disclose to SF Environment, and in turn requires the department to disclose to the public. SF Environment fulfilled this by publishing and maintaining a dataset on the open data portal. In 2015 they partnered with affected stakeholders on a report that put the data into context and found significant improvement in energy efficiency over the first few years of implementation. Through this work, they matched the transparency efforts of the 20 other peer cities with similar legislation.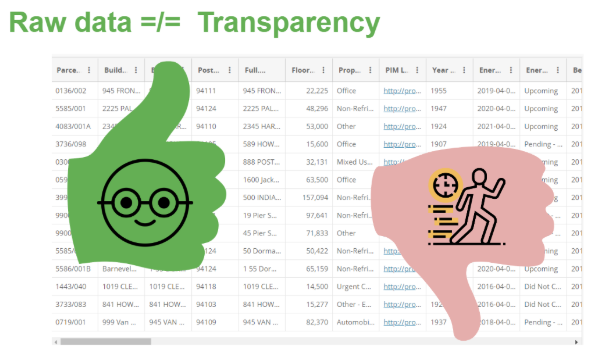
However, SF Environment was not satisfied with a single report, yet not convinced that annually publishing a printed report would have significant impact. SF Environment wanted not just transparency, but engagement. The public report, though well designed, was 30 pages long and static. It was not clear that the intended audience – building decision makers – would be motivated by further printed reports, nor that a static report can convey the purpose of the ordinance in an engaging way to stakeholders and the general public. Internally, SF Environment frequently needed to analyze the data for in-house planning and to respond to policy makers’ requests. It was great to have interest, but repetitive analysis cost staff time and was ripe for automation.
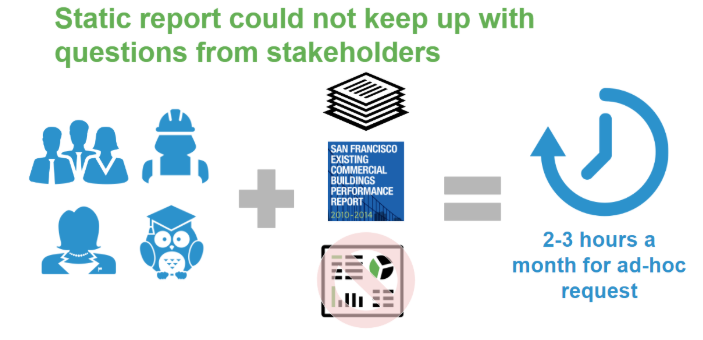
SF Environment needed an interactive, up-to-date report that would be scalable and modifiable to meet ongoing analytic requests.
What was done
SF Environment settled on PowerBI as the tool to build the report. Primary drivers of this choice were PowerBI’s ability to automate the ‘data wrangling’ portion of the project, and its flexibility to serve both internal and external audience needs.
After training from DataSF, SF Environment built out the interactive report in about 25% less time than had previously been required to develop, edit, and publish a static document. They pulled key messages and visuals from the previously commissioned annual report, but, most importantly, SF Environment’s analyst Ammon Reagan and colleagues saw this as an opportunity to step back and design something that could meet the needs of different constituent groups. SFE developed new charts, pages, and interactions to simplify communication while providing interactivity and automatic analytic refresh superior to the prior report.
The final report was launched on March 2019.
What was the outcome
San Francisco was the first city in the United States to transition to an automated, interactive annual report of Building Energy Use. Building owners, tenants, academics, and policy makers who refer to the report are able to understand why the ordinance exists, current state of energy usage, and track the performance of San Francisco’s largest buildings in the city in reducing energy use and greenhouse gas emissions.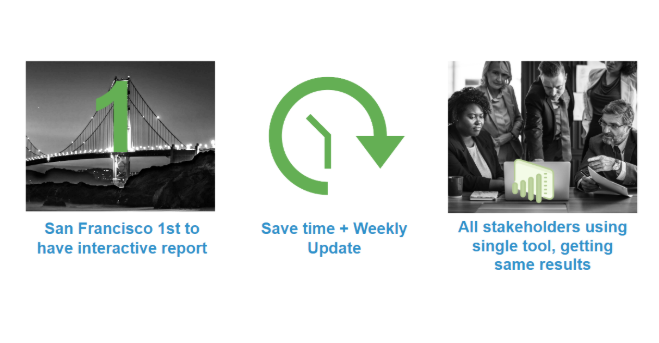
Furthermore, SF Environment internally uses the same report to shape targeted outreach and ongoing business community engagement. By reducing staff hours spent monthly on repetitive re-analysis thanks to the online report, SF Environment freed up resources for deeper analysis and more frequent direct engagement. While report development traditionally may have been contracted out, it is now done in-house with PowerBI. But most importantly, all parties – from businesses to policy makers – not only have access to the same data, but to the same insights. Full stack transparency!
Team
Ammon Reagan, SF Environment
Barry Hooper, SF Environment