Background
The residents of San Francisco need to know how well City services are meeting their needs. The job of providing an easily understandable scorecard for City services falls to the talented City Performance Unit at the Controller’s Office. Since 2015 they have maintained the memorable City Performance Scorecards: stylish dashboards that give a clean, crisp, bird’s-eye view of how the City of San Francisco is performing.
What was the problem
People loved them, residents tweeted them, all was seemingly swell…
But behind the scenes things were not so great. The scorecards were rapidly developed in 2 months to meet an urgent deadline. With 70+ charts, this left little time for process refinement. Tableau, the software used for the dashboards, required data in a specific format to visualize but offered no tools to help ‘wrangle the data’. The data came from csv flat files pulled from their performance database and were manually ‘wrangled’ in Excel to the needed format. Each time the metric needed to be updated, analysts would have to manually download the new data, update one – or sometimes multiple – Excel spreadsheets, log on to a shared computer when no one else was using it, and go through the steps to refresh and re-publish the Tableau visual.
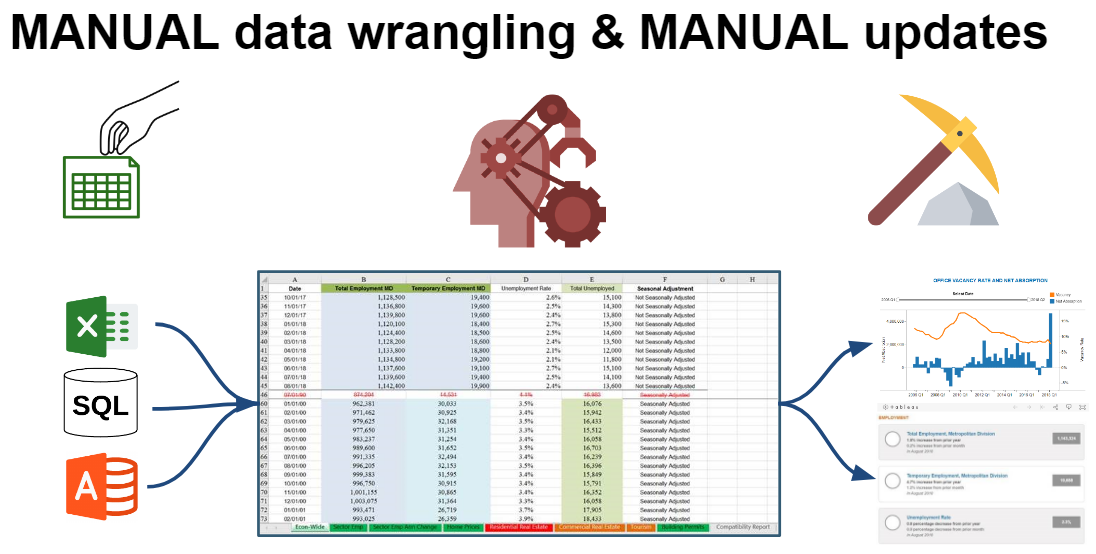
Additionally, each metric had a different update cadence (yearly, quarterly, or monthly) and rarely aligned at the same time, creating constant data wrangling work. As a result, it took roughly 5 staff , 75 hours a month just to maintain the dashboards in their original state.
The process was not just long and cumbersome; it was also not reproducible. Each staff memorized the unique quirks of their own metrics, resulting in knowledge silos. When a metric stopped updating, only that team member could diagnose, troubleshoot, and fix the problem.
The Performance Unit knew this process could perform better. Data needed to be standardized and they needed a tool that could automate the data wrangling in a more effective and efficient manner.
What was done
The Performance Unit tackled the problem in stages. First, they worked with DataSF to identify a data structure for the scorecard data including transformations and mappings for fields. The resulting dataset ishosted on the Open Data portal where it is automatically updated every day. The standardized output provides a consistent, central dataset upon which visualizations can be based.
Members of the scorecard team attended a DataSF PowerBI training. Realizing the efficiencies to be gained from automating the data transformation process, they set about converting all 70+ tableau reports to PowerBI.

###
What was the outcome
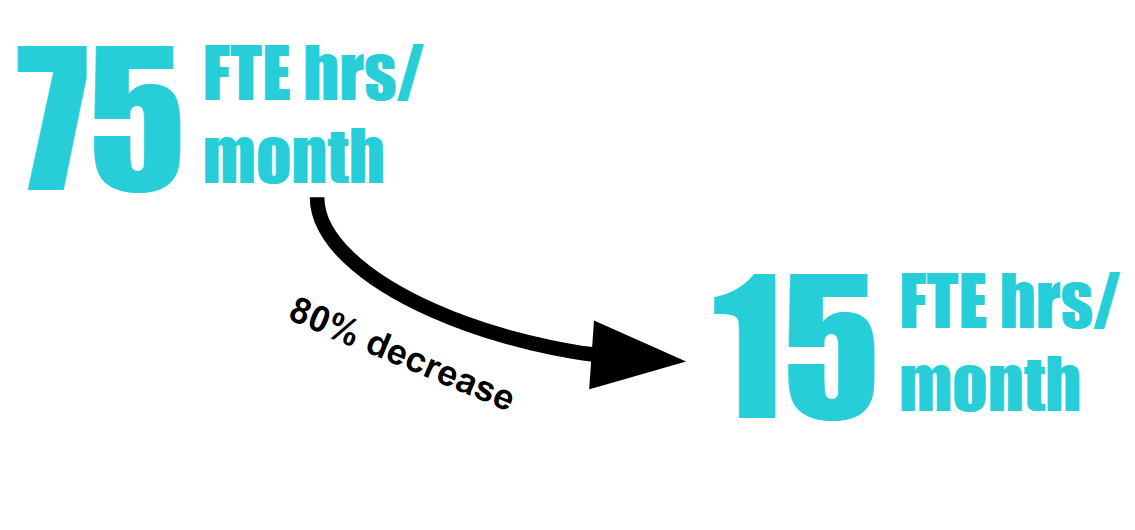
The ability of PowerBI to handle the full workflow of data analysis combined with a harmonized data source provided by open data allowed for new efficiencies. At a basic level, applying the combined force of Open Data and PowerBI saved significant staff time which translated into an immediate bottom line savings. The 75 hours a month was reduced to 15 hours a month, an 80% reduction in workload.
Although the savings in time were substantial, what was done with the time saved is even more exciting. The Performance Unit moved from Data Wrangling maintenance to continuous improvement of the scorecards. They now spend 15 hours each month iterating and improving! The results are clear. The scorecards are more dynamic and are able to tell richer stories with added visual details. A modern design sense has been applied to report card pages replacing the static landing page that existed before.
The Scorecard team is eager for your feedback on the scorecards and encourages suggestions and changes by tweeting them at @SFCityScorecard
Team
- Emily Alt, City Performance Unit, Office of the Controller
- Luke Fuller, City Performance Unit, Office of the Controller
- Alice Kassinger, City Performance Unit, Office of the Controller
- Wendy Lee, City Performance Unit, Office of the Controller
- Natash Mihal, City Performance Unit, Office of the Controller
- Cody Reneau, City Performance Unit, Office of the Controller
- Sarah Small, City Performance Unit, Office of the Controller