Background
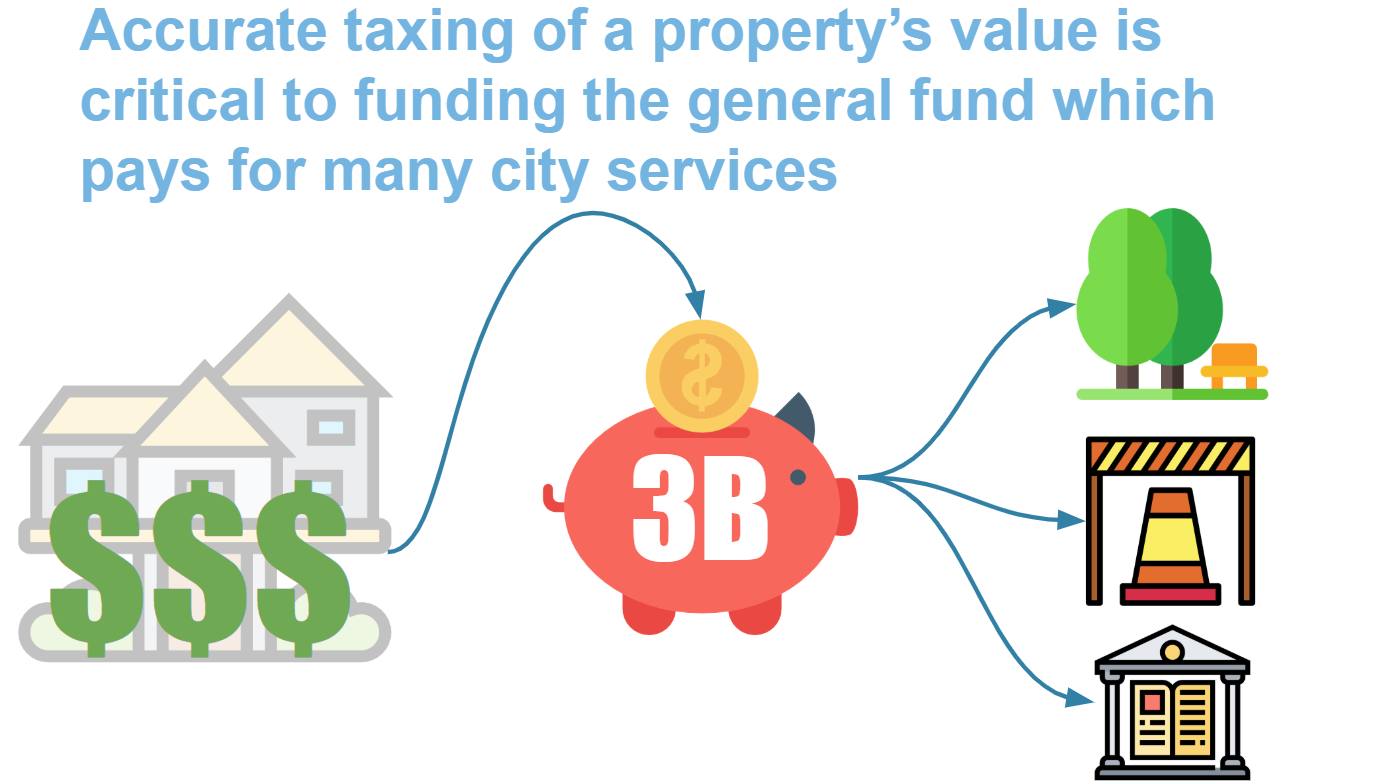
Everyday in San Francisco, new buildings and residences are being constructed. In an average year, there are over 20,000 new and ongoing construction projects. The Office of the Assessor-Recorder is responsible for providing a fair and impartial appraisal of a property’s value for the purpose of property taxation. Every year, the Assessor’s Office brought in over $3 billion in property tax revenue and two-thirds of the fund stays local supporting City services, such as public safety, parks, libraries, and health and social services.
What was the problem
With over 20,000 active construction projects, the Assessor’s Office had developed a process to prioritize and assign these projects. It was a largely manual and labor intensive process. As a result, sixty separate workbooks would be generated and these sixty workbooks would also need to be augmented with additional data for each project before the appraisers could use them as the primary tools to evaluate a property. The additional data scattered across various sources such as:
- Data submitted by taxpayers stored in their Document Management System
- Building Inspection notes from theDBI Permits dataset on the open data portal
- Historical Tax Rolls dataset from Open Data Portal
Further complicating matters, appraisers would need to process and enter the data into five different screens in their internal AS-400 system. This was then pulled into an “Error Report” for eight principal appraisers to review, identify quality control issues, and send back to appraisers for manual correction. They confirmed corrections were made by waiting until the next report in two weeks.
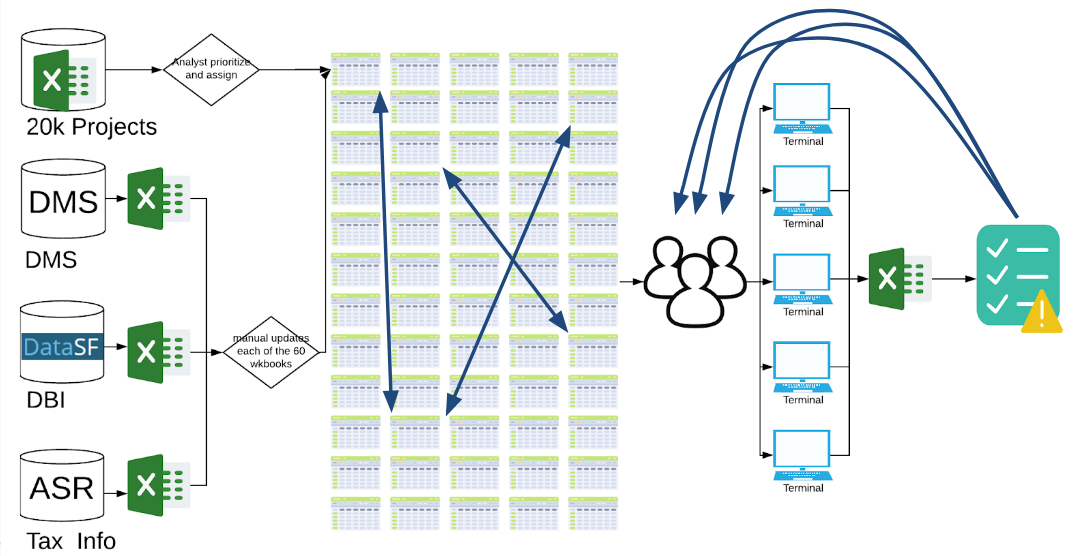
As the picture above conveys, this was a complicated undertaking, impacting almost all members of appraisal team There were numerous pain points, the biggest of which were:
- Time consuming - The manual Excel based system meant that managing and maintaining the workbooks and associate processes would require many hours of work of a single analyst.
- Quality issues - Due to the manual process, Data Quality issues were only caught after the fact and required additional manual work to fix.
What was done
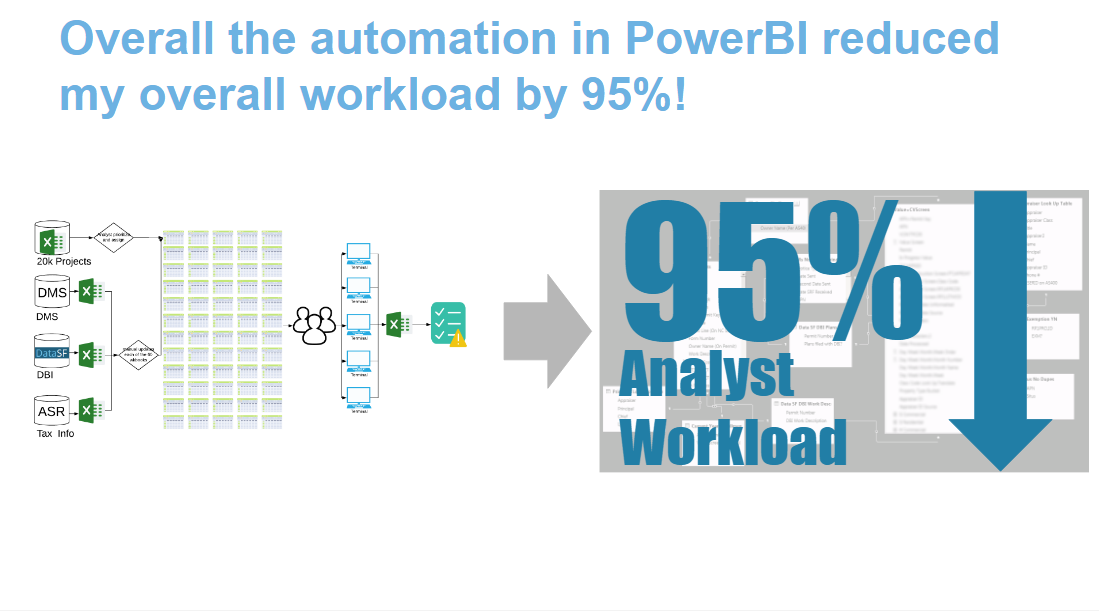
The daunting task of improving this process fell to the data analyst team and the project overhaul landed on Operations Analyst, Michelle Wong. The result was a radical transformation of the tool from a manual static Excel workbook to an automated, dynamic, Power BI report with enhanced functionality. The project was accomplished through an iterative, user-centered approach that minimized effort and maximized user buy-in.
By taking advantage of DataSF’s PowerBI courses and office hours, Michelle quickly recognized the potential to radically transform process via PowerBI. In particular, the DataSF Data Modeling course gave her the theoretical foundation to structure a system built on PowerBI which would automate the entire process. The resulting data model embedded the existing business logic into PowerBI. Instead of sixty excel workbooks, there is now a single report powered by an elegant and flexible data model. The development transition time from data model to V1 was only three weeks!
In addition, Michelle incorporated a Data Quality page that instantly alerted Appraisers if they forgot to enter a field. This caught errors (which the focus group rebranded as “Incomplete”) before they reached the principal appraisers. Furthermore, she integrated user feedback by adding advanced features such as interactive maps and additional columns to facilitate the appraisers’ tasks.
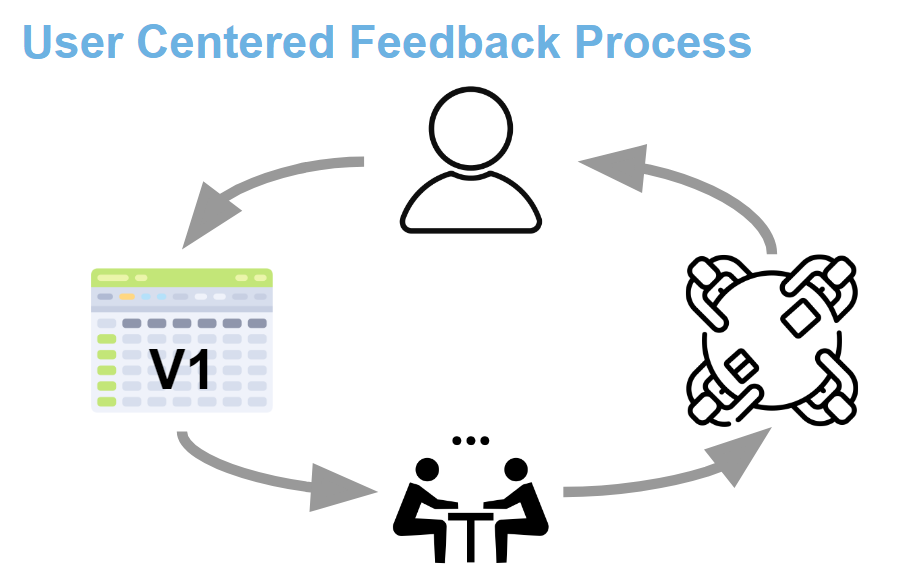
A large part of the success came from the iterative and user-centered approach Michelle took to the roll out of the new PowerBI report. Michelle created a V1 of the report that simply recreated what the appraisers were used to seeing. She created focus groups and provided office hours within ASR to help ease the transition. This built trust and excitement among staff. For example, staff asked for novel features like a searchable map to identify which sites to visit that day. This involved incorporating an entirely new dataset, but, due to the data model’s flexibility, it only took hours to deliver.
What was the outcome
The analyst tasked with shepherding the process went from 100% of time spent on this project to 5%, drastically freeing up their time for more pressing analytical needs. He went from managing the excel workbooks to managing the project as a whole. In effect, the report provided the Assessor-Recorder a new analyst.
The data quality page drastically cut the amount of errors in the final report given to Principal Appraisers to review which saved hours of staff time. It also helped change the dynamic between the Analysts and Appraisers. Before the automated data quality flags, the Analysts had to play the very unfun role of data drill sergeants. Appraisers small but consistent pain-points such as lack of a map and immediate access to information from external systems were resolved making work life more efficient.
Appraisers’ responses to the tool and the user centered process have been overwhelmingly positive.
Team
Michelle Wong, Assessor Recorder
Benjamin Lau, Assessor Recorder