We are excited to announce the release of new building footprints to the open data portal! Wait, weren’t there already buildings on the open data portal? Yes, but take a close look at the new data and you’ll see not just masses for entire blocks of buildings, but beautiful footprints for each individual structure.
And with those structures, unique identifiers and all sorts of derived data from LIDAR. But rather than tell you, let’s show you.
New ability to link and see data by building
We were so excited about the dataset, we put together a little web app that allows you to explore the buildings and related data. Check it out, click around…we’ll wait…
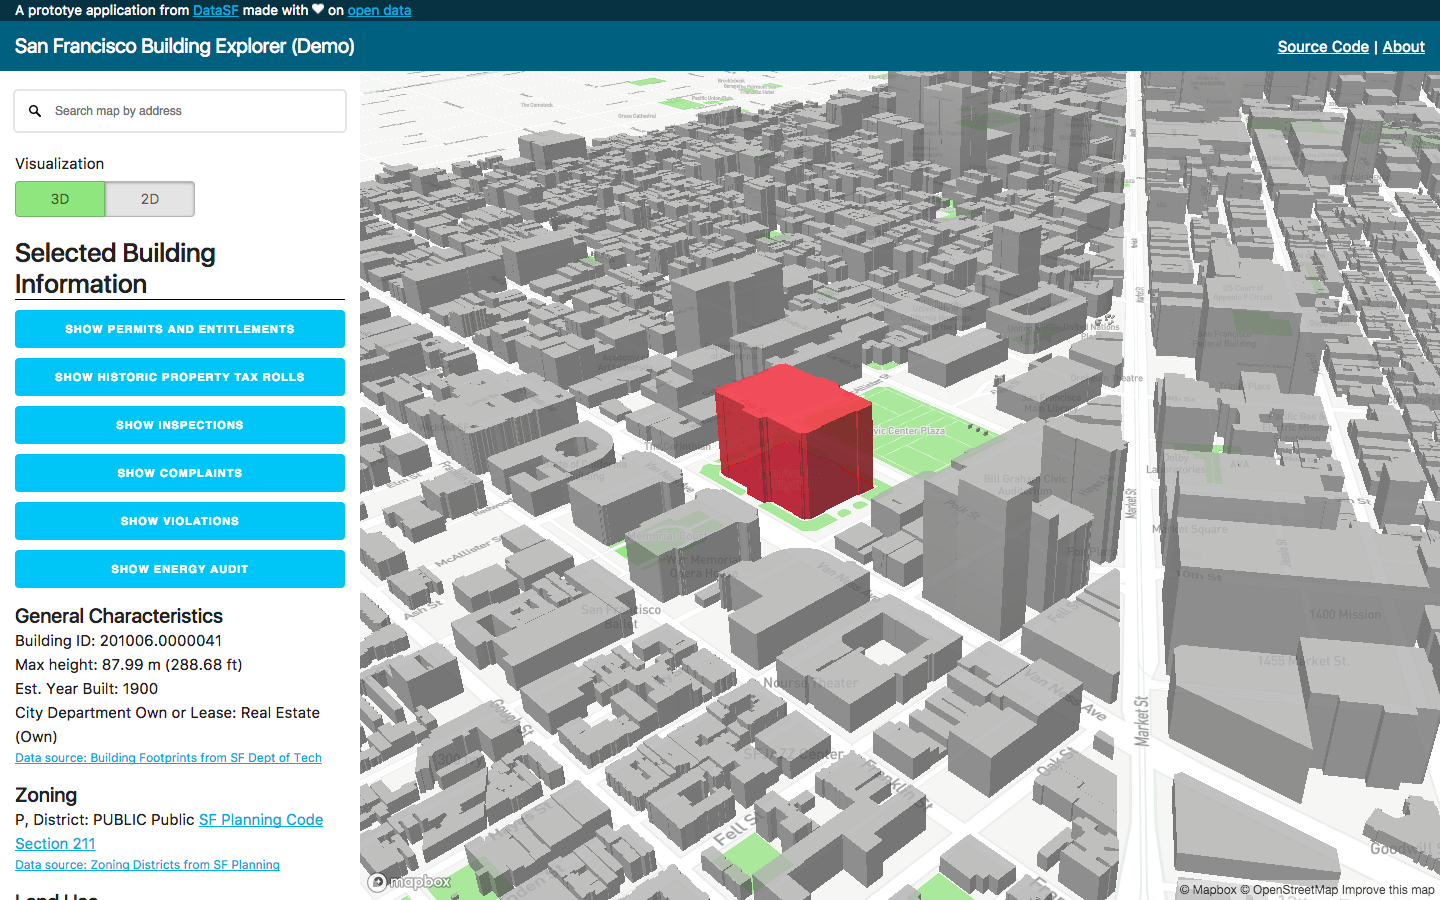
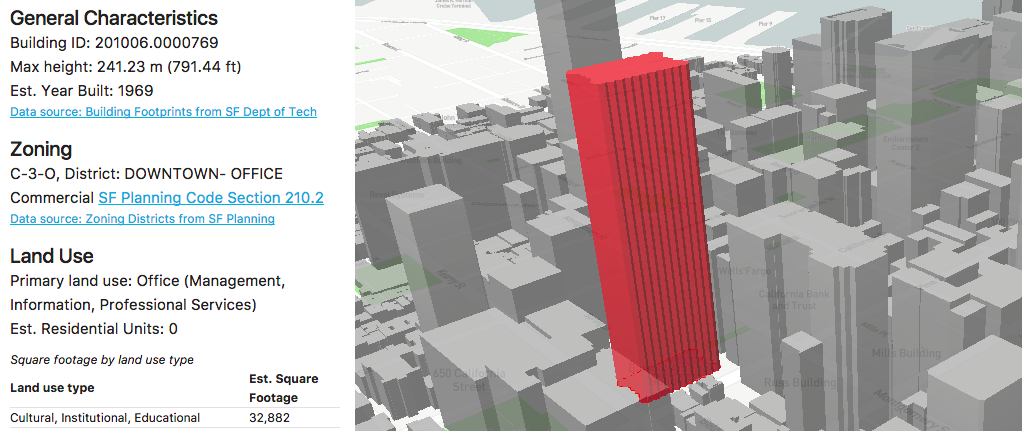
Welcome back, hopefully you had a little fun exploring the City. What you may have missed while clicking around is that we’re linking different datasets on the open data portal through the lens of buildings (permits, planning entitlements, inspections, etc.). P.S. source code available for those of you that are curious :-)
Addresses and parcels end up being pretty common geographic units on City data, but the unit of inquiry people are often interested in is the building. Many of us relate to what we see on the street or in the skyline.
The buildings are a lynchpin in a built environment data model that will provide increasingly better insights on what’s happening across the City. Imagine what we can do as the models improve, including:
- Quickly assembling block’s worth of discrete structures. Various City departments can use the structures to inform early stages of planning without starting from scratch every time.
- Making parcel-scale, detailed maps. With increasingly accurate and detailed models, you can have accurate maps at the level of a block.
- Improved shadow studies. Shadow studies become easier over time as more accurate data becomes available at scale.
City teamwork = new buildings dataset
This new data would not have been possible without the efforts of the Department of Technology’s SFGIS division, the SF Department of Environment and the City Planning Department.
We didn’t start entirely from scratch. The basic building masses had been developed from 2010 LIDAR data using photogrammetry from aerial photos for extra detail. The resulting 3D model was optimized for visualization. That model was flattened to produce the city building footprint layer that has been available for five years. Last year, those footprints were split using a manual process informed by parcel lines and orthoimagery. Those discrete building footprints were placed in 3D using LIDAR-derived ground surface and structure roof models. Each structure was assigned an ID and 3D statistics summarized. You can read more about the methodology in the documentation attached to the dataset.
Where we’re going: data model for the built environment
Now that we have this initial set of building footprints, we begin the work of linking buildings to addresses, parcels and all the related administrative data. There are nuances here (for another time) but it’s not a problem that a little grit and organization can’t solve.
We’re also considering how to turn this data into something living, updated as the city changes–currently the data represent a point in time. When it becomes dynamic, this becomes an even more powerful resource not just for open data enthusiasts but for City departments.
Even without dynamic updates, we find this data to be tremendously useful and we hope you do too. So go forth, dive into the data, use it in an app or analysis and tell us what you think.