One of the most frequent questions I get about open data is - why? Most folks understand the need for transparency and openness in government, but some question the need to invest the effort in a comprehensive open data effort.
And to be perfectly fair - very few folks have measured the impact of open data. Since we love being data-driven, we decided to attempt measuring open data. This blog post summarizes what we’re doing and we want to hear your thoughts and feedback so we can learn together.
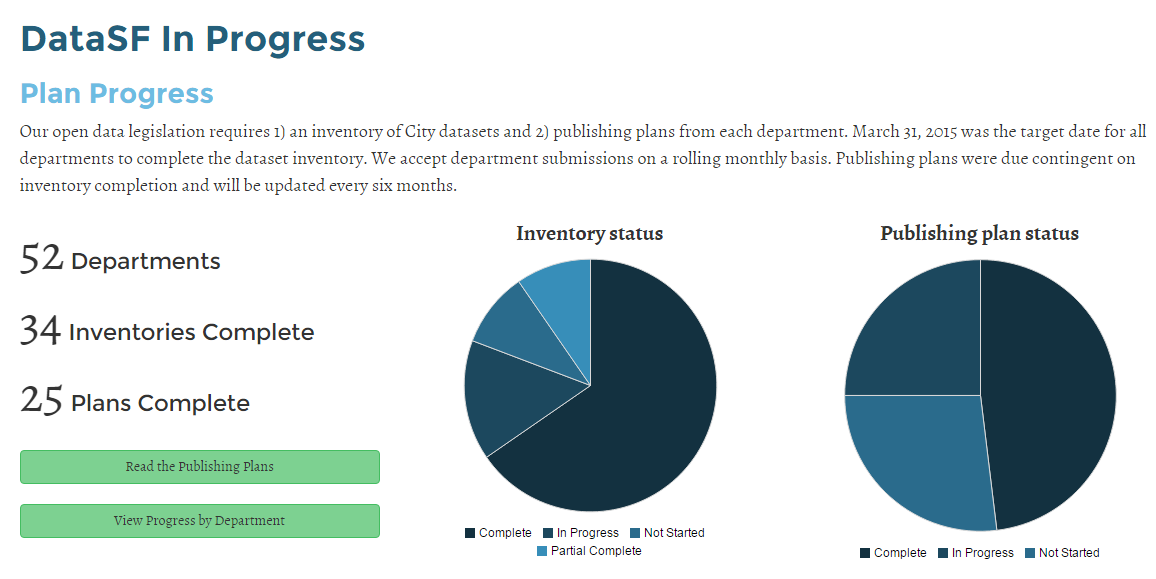
Learn more below or dive into DataSF in Progress - where you can track our metrics in real time! Or read our evaluation and performance plan available here.
Number of datasets is a bad success measure
Early on, it became clear - we cannot measure open data by counting the number of datasets. A couple problems with this:
- It incents the wrong behavior. If we publish every year as a different dataset, our N goes up but data usability goes down. If we publish low value data, our N goes up but no one wants to use it. While it’s important to track - # of datasets shouldn’t be a key performance indicator (KPI).
- It diverts focus from quality. Publishing to increase your N distracts from ensuring high quality publishing - data that is documented, updated regularly and of value.
Limited guidance and a focus on case studies
Our research review revealed that there was not a bunch of guidance on how to measure open data and many of the benefits to open data relied on example case studies. Case studies are important but hard to quantify.
One of the most frequently cited estimates of the impact of open data is a 2013 McKinsey report that estimates open data will create $3-5 trillion in value. Unfortunately, the report doesn’t offer a methodology that can be replicated.
Our framework: Logic Model + Measures
Our approach relies on a logic model that provides a theoretical framework plus a set of measures for tracking our performance.
Logic Model: Our theoretical framework
Our logic model provides a framework for linking our activities to the ultimate outcomes we hope for, namely:
- A robust and innovative economy
- Quality outcomes for residents, businesses, and visitors using City services
- Increased engagement and empowerment
- Ultimately - excellent quality of life and work in the City
These are lofty outcomes - how do we relate the Open Data program to them? Our logic model provides the theoretical linkages (though we haven’t figured out a good way to measure them).
Measures for Activity, Quality and Impact
Since our ultimate outcomes are hard to track, we rely on a variety of indirect measures - starting from how much we publish to what’s being done with it. Our metrics fall into 3 groups:
- How much did we do? (activity metrics)
- How well did we do it? (quality metrics)
- Is anyone better off as a result? (impact metrics)
(You may notice these look suspiciously like the Results Based Accountability, RBA, approach…that’s because we are using it ;-)
Publishing Activity
Our publishing activity measures progress on our dataset inventory (learn about this process) and publishing plans (view plans). Both of these are mandated by our open data legislation.
We also track publishing activity by department, priority level and classification as percentages. Percents allow us to compare performance without distorting incentives.
Publishing Quality
Our quality metrics track how well we publish when we publish:
- Performance against target. Every six months, we identify the number of datasets to publish. These measures track how we are performing against those targets.
- Timeliness of publishing. Fresh data is better than old data. Data should be updated per our commitment captured in the metadata for each dataset.
- Documentation and Usability. Data that isn’t documented puts extra burden on the user and results in unnecessary question loops. Native hosting allows our users to fully leverage our open data services.
We have now added all of our quality metrics to DataSF in Progress - where you can track them real time! Couple notes on how we’ve built this:
- We track all the needed variables in a handful of public datasets (data inventory, metadata, and published views)
- We use our open data API to populate our dashboard
Publishing Impact
If we publish a bunch of data in a quality manner, it doesn’t matter if no one uses it. This is where our impact measures come into play. They are the hardest to measure and require deliberate data collection. At this time, our impact measures focus on internal metrics. While we’ve attempted external surveys, our “n” has been too low to infer anything from the data. In lieu of this, we are exploring “net promoter” scores and other methods. Welcome thoughts on this one.
Until then, we will collect the following data via annual surveys and will add to our dashboard as we have multiple years.
- Respondents indicating that SF OpenData has made their analytical work easier, faster or more accurate
- Respondents indicating a reduction in medium or major barriers to use of data
- Respondents indicating sufficient access to data produced or collected by other departments
We’ll also try to capture additional impact via:
- Case studies or stories of uses of open data
- Focus groups or workshops
- Counts of apps or websites “Made with Open Data” as part of our new showcase. This may include some basic impact questions like “how important was open data to creating your service”.
Read our entire Evaluation and Performance Plan for Open Data, which provides details on our approach, including desired trends, etc. Drop us a note if you think we are missing something key!