A couple weeks ago, we announced the Housing Data Hub! In this blog-post, read about our technical and process approach to building the hub and what’s next.
Prototyping together: the Housing Data Hub as process
The Housing Data Hub was born out of the notion that in order to mature our open data practice at the City, we needed to diversify our approach to publishing data. In the City’s open data strategy, a quick look at datasets over time reveals a publishing stagnation. While the inventory process will help us bring institutional focus and planning to citywide data, Joy hit on the idea early on that we also needed to release datasets strategically around common themes or topics. Housing affordability is our first one.
These strategic (or thematic) releases allow us to apply focused, collaborative effort around a number of related datasets. Joy lays out more about this approach in her housing data hub announcement. The key challenge was how to turn a concept into action - this is where technology met process.
Getting started
One of the key parts of a strategic release is to bundle data with a product. This could be a website, a report, a study, or any product that helps frame and focus the activity around the data. In this case, we imagined a website that presented the portfolio of local policies that affect housing affordability in San Francisco in a clearer manner.
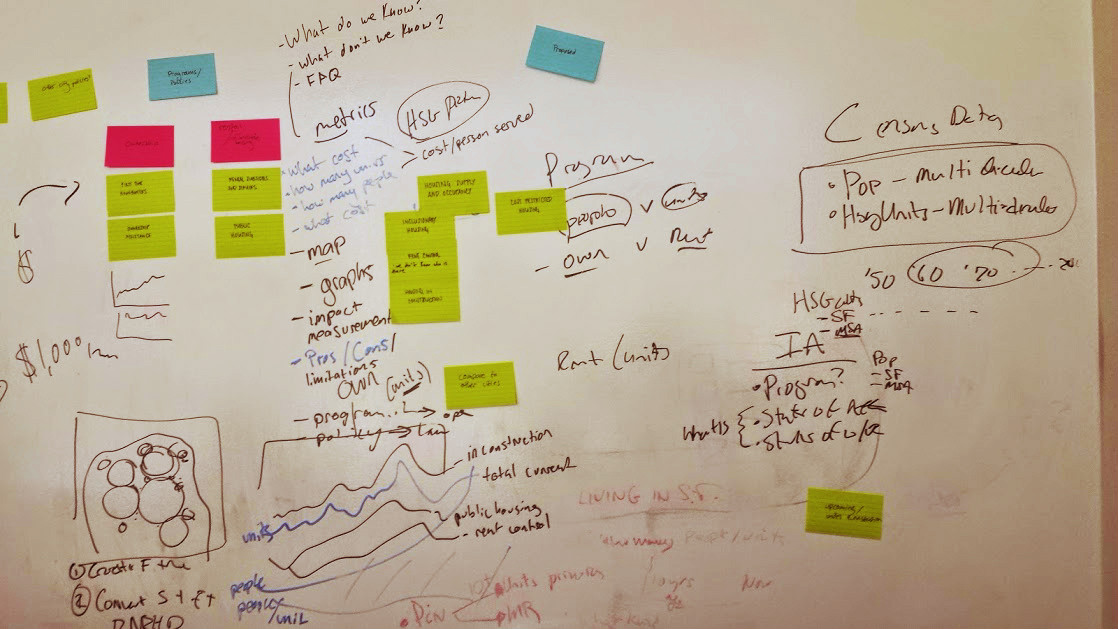
With a concept and buy in from departments, Joy began work. Starting with paper prototypes and content drafts, the first push on code began during the 2014 National Day of Civic Hacking weekend in San Francisco. Working with local Code for San Francisco volunteers (read about our weekend ), the concept was fleshed out in code using the Ruby on Rails framework.
Changing technical direction
The volunteer work was incredibly useful for crystallizing the concepts you see in the hub today like the data browser and policy pages. But we hit some challenges using Ruby on Rails for both a content management system (CMS) and to store data.
It was hard to iterate fast enough to get content in for review by our content partners. And loading data into a separate database introduced failure points between the source data and the visuals.
Using Prose as a lightweight CMS
After huddling and laying out the options, we decided to adopt a lighter weight approach. It turned out we didn’t really need full CMS-like capability. The content could be edited in iterations outside the website, and once the content was set, changes would be infrequent. Any CMS capabilities that ended up being built would go underused. It just didn’t make sense to apply the effort there. Instead, we focused on making it easy to configure visuals and consume external data sources. We leaned on emerging CMS-less practices for content including using Prose.io as a basic editing interface.
From database to dogfood
And instead of using a separate database via Ruby on Rails - we used open data APIs from our portal. This allows us to have the data in a single place and use the same set of tools as our open data portal users. This approach is often referred to as dogfooding, which you can read more about in the great blog-post by Anthea Watson Strong.
And we were able to save much of the original front-end work from National Day of Civic Hacking weekend (sign up for 2015) even though we changed the underlying technology. Ultimately, I don’t see this as a failure, but as an important learning moment and maybe even a necessary part of working in the open. We had to travel down some roads to discover what would work, and being able to put eyes on some code helped us crystallize the approach.
The technology stack
To implement the desired changes, we evaluated and then picked a mix of frameworks and code libraries that would help us ship the product. The core ones being:
- Jekyll - a static site compiler and the core of our CMS-less approach. It allows us to quickly develop content and templates to display that content. You can read more about how we’ve applied it on the DataSF website.
- C3js - a javascript library that allows the creation of reusable charts wrapped around the incredible D3 visualiztion library. The most important feature here for our process is that we could throw a CSV or JSON file at it, allowing us to prototype with CSVs and swap in JSON API endpoints from our portal later.
- Mapbox.js - a javascript library wrapped around the mapping library, Leaflet, that makes consuming map tiles from Mapbox easy and inherits all of the sweet capabilities of Leaflet. This lets us present the user with mapped data, consuming geojson for breakfast, which is great because our open data portal now supports that format.
There are many other libraries and inspirations mentioned in our acknowledgements, but these three drive the primary features of the Hub.
It takes a village
The change in technology direction removed a major bottleneck and allowed us to implement changes quickly. We worked with department and citizen user reviewers to check content for accuracy as well as ease of understanding (government prose is not always the easiest to decipher ![]() ). By having prototypes in place fast, we were able to gather around a real thing and not just an abstract concept: the technology didn’t drive the development, it supported our process of co-creating with multiple stakeholders of varying degrees of technical ability.
). By having prototypes in place fast, we were able to gather around a real thing and not just an abstract concept: the technology didn’t drive the development, it supported our process of co-creating with multiple stakeholders of varying degrees of technical ability.
Hopefully, you can tell by now, that many many hands (and hearts) touched this project. Not just the folks we’ve acknowledged on the hub already, but the countless coders that have contributed thousands of lines of code to the open source projects on which we’re building.
And that goes to an even broader takeaway. This whole opengov, open data, civic tech (whatever you call it) movement must be built on community. We learn together, which is why we attempt to share as much as we can here on our website. We hope in sharing, we learn even more from everyone else.
What’s next?
The Hub remains a work in progress. You’ll notice, if you look closely, that not all datasets are being fed directly from the portal. We are simultaneously working on getting datasets published to the portal regularly and consistently (per Goal 1 of our Open Data Strategy). As we get those up, we’ll swap out the generated CSVs for an API call to the portal. As mentioned, C3js enables this flexible pattern. You can track the progress of that transition on the Hub’s about page.
A little spring cleaning
If you look even closer, you’ll notice the code is a bit sloppy ![]() ! We’re about to freeze the featureset and refactor and document the project in greater detail. We’re kicking the tires on this approach, so I’ll be develop standards for documenting earlier and often and employing better code practices. There’s plenty of inspiration here from 18F and various open source communities that I can’t wait to borrow from.
! We’re about to freeze the featureset and refactor and document the project in greater detail. We’re kicking the tires on this approach, so I’ll be develop standards for documenting earlier and often and employing better code practices. There’s plenty of inspiration here from 18F and various open source communities that I can’t wait to borrow from.
We’ll work on getting some issues up on the repo and working more with civic hackers and volunteers on the next rounds of improvements. Keep an eye out, and if you want to help, let us know! (Oh, and maybe swing by National Day of Civic Hacking 2015)
From product to platform
Now that we’ve gone deep, we’re thinking broad. What if we want to spin up something similar again? Or what if another city would like to do the same? After we get the fundamentals down with the refactor, we’ll be looking to abstract the approach so others can follow suit. At a minimum, this means really great documentation, cleaning out the specific content, and using good conventions to maintain the project.
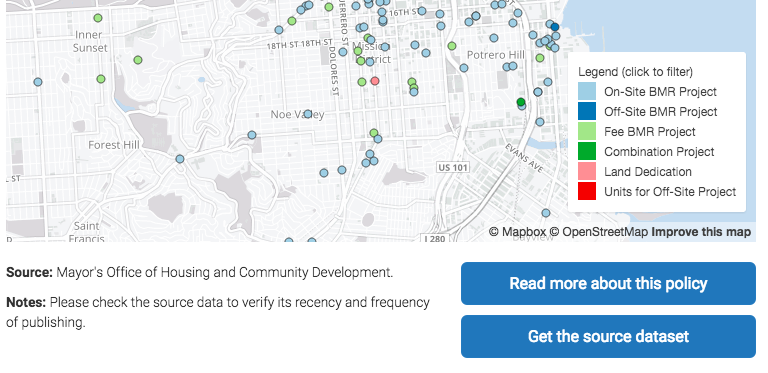
Even more broadly, I’ll point you to a seemingly small feature that actually has larger implications for our strategic approach. On visualizations for which the underlying data are available on the open data portal, you’ll see a “Get the source dataset” button. Following this takes you to the full dataset on SF OpenData, where you can explore and download the data. This is a small but important step toward creating enduring sources of truth and unbroken data lineages. Gone will be the days of shipping spreadsheets and reports around and losing track of what came from where, and it all starts with that simple, blue button.